Question 1.
Solve graphically :
(i) x ≥ 0
Solution:
Consider the line whose equation is x = 0. This represents the Y-axis.
To find the solution set, we have to check any point other than origin.
Let us check the point (1, 1)
When x = 1, x ≥ 0
∴ (1, 1) lies in the required region
Therefore, the solution set is the Y-axis and the right
side of the Y-axis which is shaded in the graph.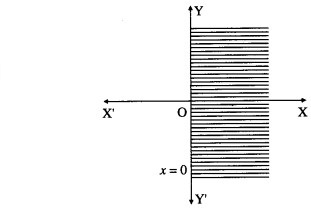
(ii) x ≤ 0
Solution:
Consider the line whose equation is x = 0.
This represents the Y-axis.
To find the solution set, we have to check any point other than origin.
Let us check the point (1, 1).
When x = 1, x ≰ 0
∴ (1, 1) does not lie in the required region.
Therefore, the solution set is the Y-axis and the left side of the Y-axis which is shaded in the graph.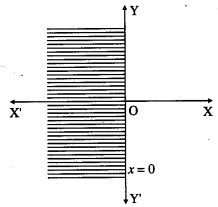
(iii) y ≥ 0
Solution:
Consider the line whose equation is y = 0. This represents the X-axis. To find the solution set, we have to check any point other than origin. Let us check the point (1, 1).
When y = 1, y ≥ 0
∴ (1, 1) lies in the required region.
Therefore, the solution set is the X-axis and above the X-axis which is shaded in the graph.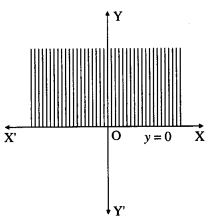
(iv) y ≤ 0
Solution:
(iv) Consider the line whose equation is y = 0. This represents the X-axis.
To find the solution set, we have to check any point other than origin.
Let us check the point (1, 1).
When y = 1, y ≰ 0.
∴ (1, 1) does not lie in the required region.
Therefore, the solution set is the X-axis and below the X-axis which is shaded in the graph.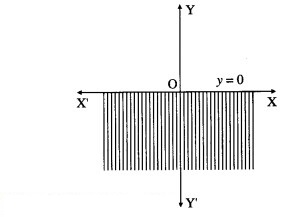
Question 2.
Solve graphically :
(i) x ≥ 0 and y ≥ 0
Solution:
Consider the lines whose equations are x = 0, y = 0.
These represents the equations of Y-axis and X-axis respectively, which divide the plane into four parts.
(i) Since x ≥ 0, y ≥ 0, the solution set is in the first quadrant which is shaded in the graph.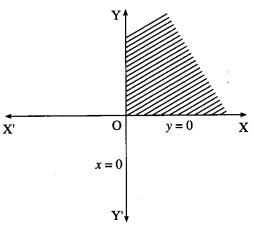
(ii) x ≤ 0 and y ≥ 0
Solution:
Since x ≤ 0, y ≥ 0, the solution set is in the second quadrant which is shaded in the graph.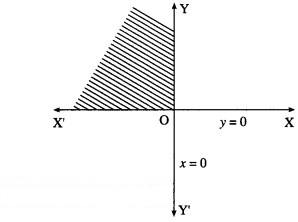
(iii) x ≤ 0 and y ≤ 0
Solution:
Since x ≤ 0, y ≤ 0, the solution set is in the third quadrant which is shaded in the graph.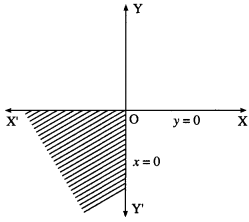
(iv) x ≥ 0 and y ≤ 0
Solution:
Since x ≥ 0, y ≤ 0, the solution set is in the fourth ! quadrant which is shaded in the graph.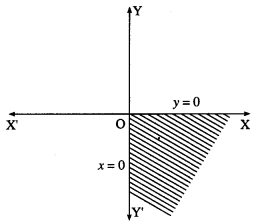
Question 3.
Solve graphically :
(i) 2x – 3 ≥ 0
Solution:
Consider the line whose equation is 2x – 3 = 0,
i.e. x = 3/2
This represents a line parallel to Y-axis passing through the point (3/2, 0)
Draw the line x =3/2.
To find the solution set, we have to check the position of the origin (0, 0).
When x = 0, 2x – 3 = 2 × 0 – 3 = -3 ≱ 0
∴ the coordinates of the origin does not satisfy the given inequality.
∴ the solution set consists of the line x = 3/2 and the non-origin side of the line which is shaded in the graph.
(ii) 2y – 5 ≥ 0
Solution:
Consider the line whose equation is 2y – 5 = 0, i.e. y = 5/2
This represents a line parallel to X-axis passing through the point (0, 5/2).
Draw the line y = 5/2.
To find the solution set, we have to check the position of the origin (0, 0).
When y = 0, 2y – 5 = 2 × 0 – 5 = -5 ≱ 0
∴ the coordinates of the origin does not satisfy the given inequality.
∴ the solution set consists of the line y = 5/2 and the non-origin side of the line which is shaded in the graph.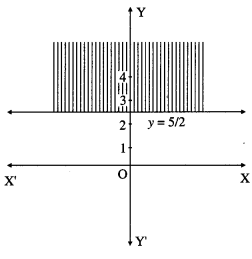
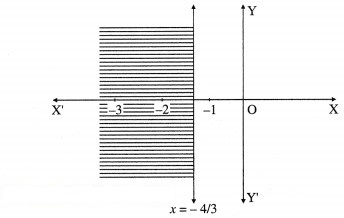
(iii) 3x + 4 ≤ 0
Solution: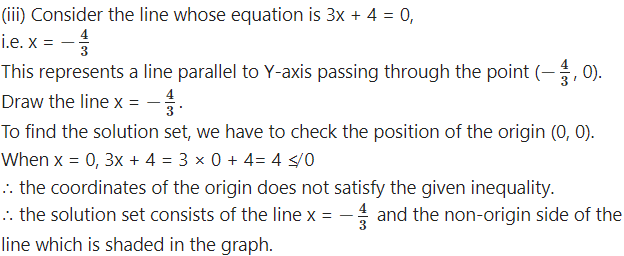
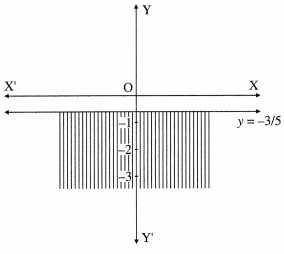
(iv) 5y + 3 ≤ 0
Solution: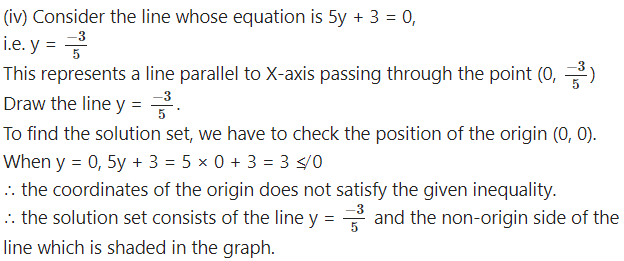
Question 4.
Solve graphically :
(i) x + 2y ≤ 6
Solution:
Consider the line whose equation is x + 2y = 6.
To find the points of intersection of this line with the coordinate axes.
Put y = 0, we get x = 6.
∴ A = (6, 0) is a point on the line.
Put x = 0, we get 2y = 6, i.e. y = 3
∴ B = (0, 3) is another point on the line.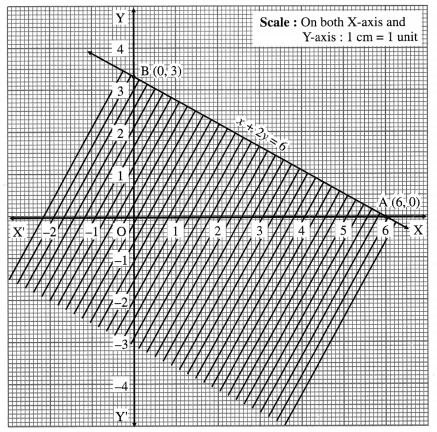
Draw the line AB joining these points. This line divide the line into two parts.
1. Origin side 2. Non-origin side
To find the solution set, we have to check the position of the origin (0, 0) with respect to the line.
When x = 0, y = 0, then x + 2y = 0 which is less than 6.
∴ x + 2y ≤ 6 in this case.
Hence, origin lies in the required region. Therefore, the given inequality is the origin side which is
shaded in the graph.
This is the solution set of x + 2y ≤ 6.
(ii) 2x – 5y ≥ 10
Solution:
Consider the line whose equation is 2x – 5y = 10.
To find the points of intersection of this line with the coordinate axes.
Put y = 0, we get 2x = 10, i.e. x = 5.
∴ A = (5, 0) is a point on the line.
Put x = 0, we get -5y = 10, i.e. y = -2
∴ B = (0, -2) is another point on the line.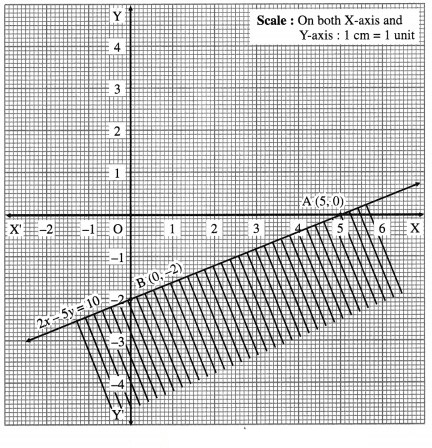
Draw the line AB joining these points. This line J divide the plane in two parts.
1. Origin side 2. Non-origin side
To find the solution set, we have to check the position of the origin (0, 0) with respect to the line. When x = 0, y = 0, then 2x – 5y = 0 which is neither greater nor equal to 10.
∴ 2x – 5y ≱ 10 in this case.
Hence (0, 0) will not lie in the required region.
Therefore, the given inequality is the non-origin side, which is shaded in the graph.
This is the solution set of 2x – 5y ≥ 10.
(iii) 3x + 2y ≥ 0
Solution:
Consider the line whose equation is 3x + 2y = 0.
The constant term is zero, therefore this line is passing through the origin.
∴ one point on the line is O ≡ (0, 0).
To find the another point, we can give any value of x and get the corresponding value of y.
Put x = 2, we get 6 + 2y = 0 i.e. y = – 3
∴ A = (2, -3) is another point on the line.
Draw the line OA.
To find the solution set, we cannot check (0, 0) as it is already on the line.
We can check any other point which is not on the line.
Let us check the point (1, 1)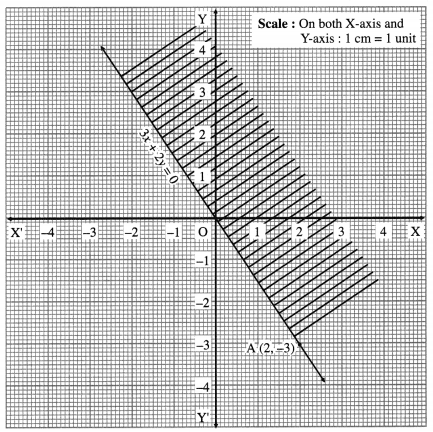
When x = 1, y = 1, then 3x + 2y = 3 + 2 = 5 which is greater than zero.
∴ 3x + 2y > 0 in this case.
Hence (1, 1) lies in the required region. Therefore, the required region is the upper side which is shaded in the graph.
This is the solution set of 3x + 2y ≥ 0.
(iv) 5x – 3y ≤ 0
Solution:
Consider the line whose equation is 5x – 3y = 0. The constant term is zero, therefore this line is passing through the origin.
∴ one point on the line is the origin O = (0, 0).
To find the other point, we can give any value of x and get the corresponding value of y.
Put x = 3, we get 15 – 3y = 0, i.e. y = 5
∴ A ≡ (3, 5) is another point on the line.
Draw the line OA.
To find the solution set, we cannot check 0(0, 0), as it is already on the line. We can check any other point which is not on the line.
Let us check the point (1, -1).
When x = 1, y = -1 then 5x – 3y = 5 + 3 = 8
which is neither less nor equal to zero.
∴ 5x – 3y ≰ 0 in this case.
Hence (1, -1) will not lie in the required region. Therefore, the required region is the upper side which is shaded in the graph.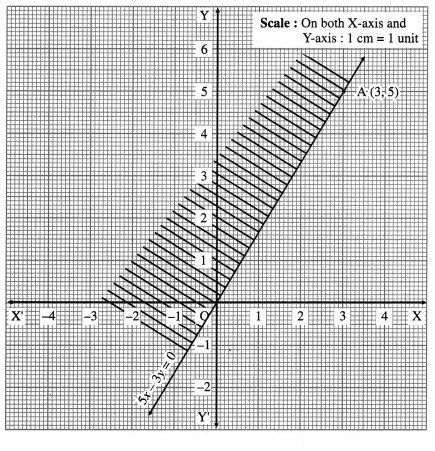
This is the solution set of 5x – 3y ≤ 0.
Question 5.
Solve graphically :
(i) 2x + y ≥ 2 and x – y ≤ 1
Solution:
First we draw the lines AB and AC whose equations are 2x + y = 2 and x – y = 1 respectively.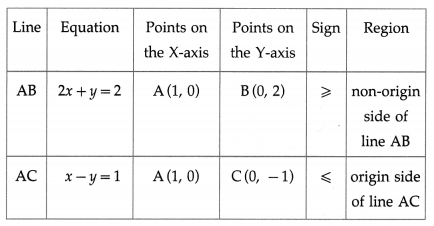
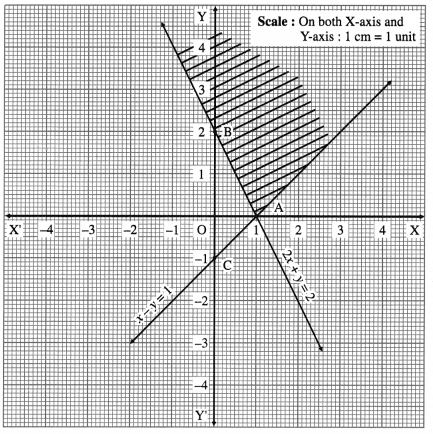
The solution set of the given system of inequalities is shaded in the graph.
(ii) x – y ≤ 2 and x + 2y ≤ 8
Solution:
First we draw the lines AB and CD whose equations are x – y = 2 and x + 2y = 8 respectively.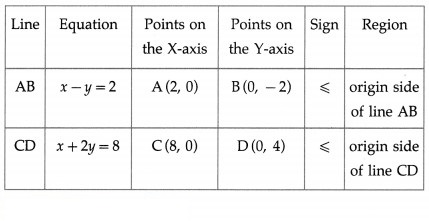
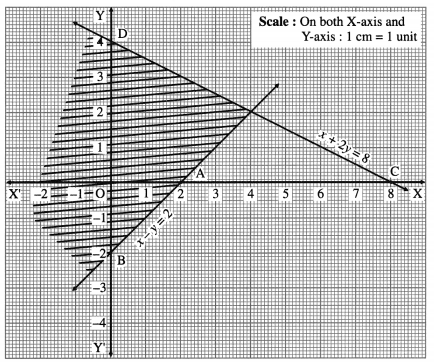
The solution set of the given system of inequalities is shaded in the graph.
(iii) x + y ≥ 6 and x + 2y ≤ 10
Solution:
First we draw the lines AB and CD whose equations are x + y = 6 and x + 2y = 10 respectively.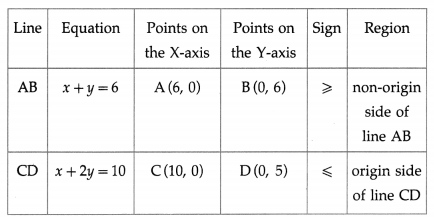

The solution set of the given system of inequalities is shaded in the graph.
(iv) 2x + 3y ≤ 6 and x + 4y ≥ 4
Solution:
First we draw the lines AB and CD whose equations are 2x + 3y = 6 and x + 4y = 4 respectively.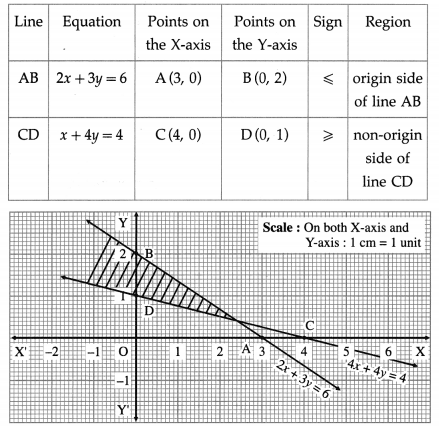
The solution set of the given system of inequalities is shaded in the graph.
(v) 2x + y ≥ 5 and x – y ≤ 1
Solution:
First we draw the lines AB and CD whose equations are 2x + y = 5 and x – y = 1 respectively.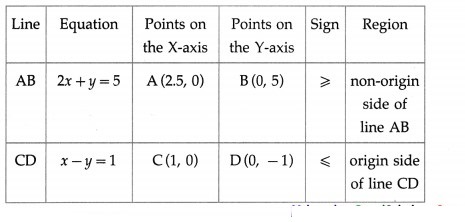
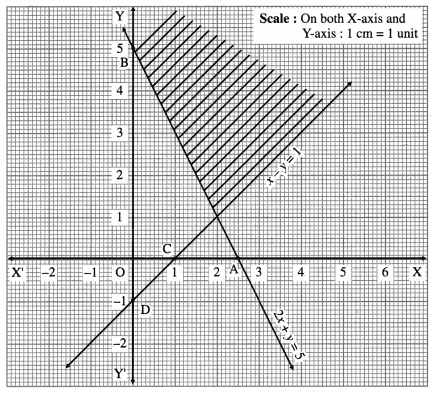
The solution set of the given system of inequations is shaded in the graph.
